Howdy! Your TLS pest again 
Versions: snmp4j-2.8.jar anmp4j-agent-2.6.4
So I use the sampling profiler I can see TLSTM$ServerThread.run and our.corp.package.ClientUpdateTask.run being the slowest items. That update task sends back to connected ‘clients’ using snmp.broadcast(moCollection);
Used flight recorder and got TLSTM$SocketEntry.addRegistration at 48.83% and ServerThread.processPending at 28.09%
TLSTM is transport so it definitely seems to be TCP vs TLS transport differences
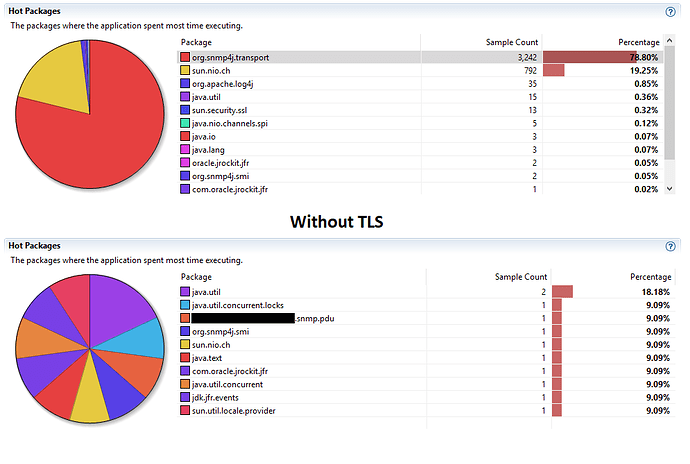
org.snmp4j.transport package took up 78.8% of the samples
Seems like it’s too slow to process tasks off the ServerThread task map? Meaning: “client side” snmp.broadcast(moCollection) from ClientUpdateTask sends to Server and then that is worked off the ServerThread… so it seems like that relationship is the slow-down…
In comparison, by simply swithcing to TCP Transport, with no other code changes, we see the largest consumers in TCP has everything alot more even and transport is not even in the top 10.
So simple question: Is this a crypto overhead that should be expected, despite not seeing any of the crypto classes in the profiler samples? Or an implementation issue despite TCP working with the same slowness??
Sincere thanks as always!!
My answer to your question primarily depends on your usage scenario of the TLS transport. If you create a new connection for every packet, the figures would not surprise me. The TLS overhead regarding number of send bytes and packets is tremendous.
Another reason however, could be that the selector(s) used for the NIO network communication signalises in Selector.select() that an operation is ready and SNMP4J is no able to clear that signal because the operation is not ready in fact.
But such a scenario would be rather a bug in the JDK or operating system used than in the SNMP4J code (as far as I understand the code and API). Or do you encounter a constantly high CPU usage without any messages being sent over the wire?
Appreciate the reply. Indeed, trying hard to pinpoint the difference in performance. Will try to reply, but feeling very dumb at this point 
-
…create a new connection for every packet
Code is creating 1 instance of a TLS transport SNMP per ‘client’ or ‘agent’. From the PDU processing side of it… all I’m seeing is methods on the snmp connection being called like get I see a new instance of a ScopedPDU created, but don’t see any new connection or “sessions” (thinking like jdbc here??) made on that connection. ither way, even if we are somewhere doing overhead of new connection creates, you would think the same behavior would be seen TLS or non-TLS…???
-
JDK or OS
Using Java 1.8.0_202 and same perf issue is seen on both Windows 10 and RHEL 6.10.x
-
CPU usage
Not even a ‘spike’…
Seems like the java profiler could ‘sniff’ out heavy usage within the cyrpto libs is indeed this was TLS overhead? In regards to the nio and Selector… those would be the same ones used TLS or Non TLS? And when we moved back to non-tls no issues with no code changes… only changing the Transport?
Going to see if moving into Java 9+ and the 3.x versions of snmp4j make any difference but that would not be a ‘today’ productionable move for us, but at least another datapoint.
Sadly, even just 1 connected ‘client’ to the server causes same behavior; windows or linux. Tried open jdk 8 instead of oracle… and same behavior. We will hope that when we are able to move into jdk 9+ that we see same ‘relief’. What continues to be even more of a mystery and does lend to the overhead statements, is our large bulk gets don’t ‘suffer’ as much as our little broadcasts. Thank you!

